Breakout Lines
Breakout Lines by XEB06 !
This isn't any magical Indicator or the Holy Grail.
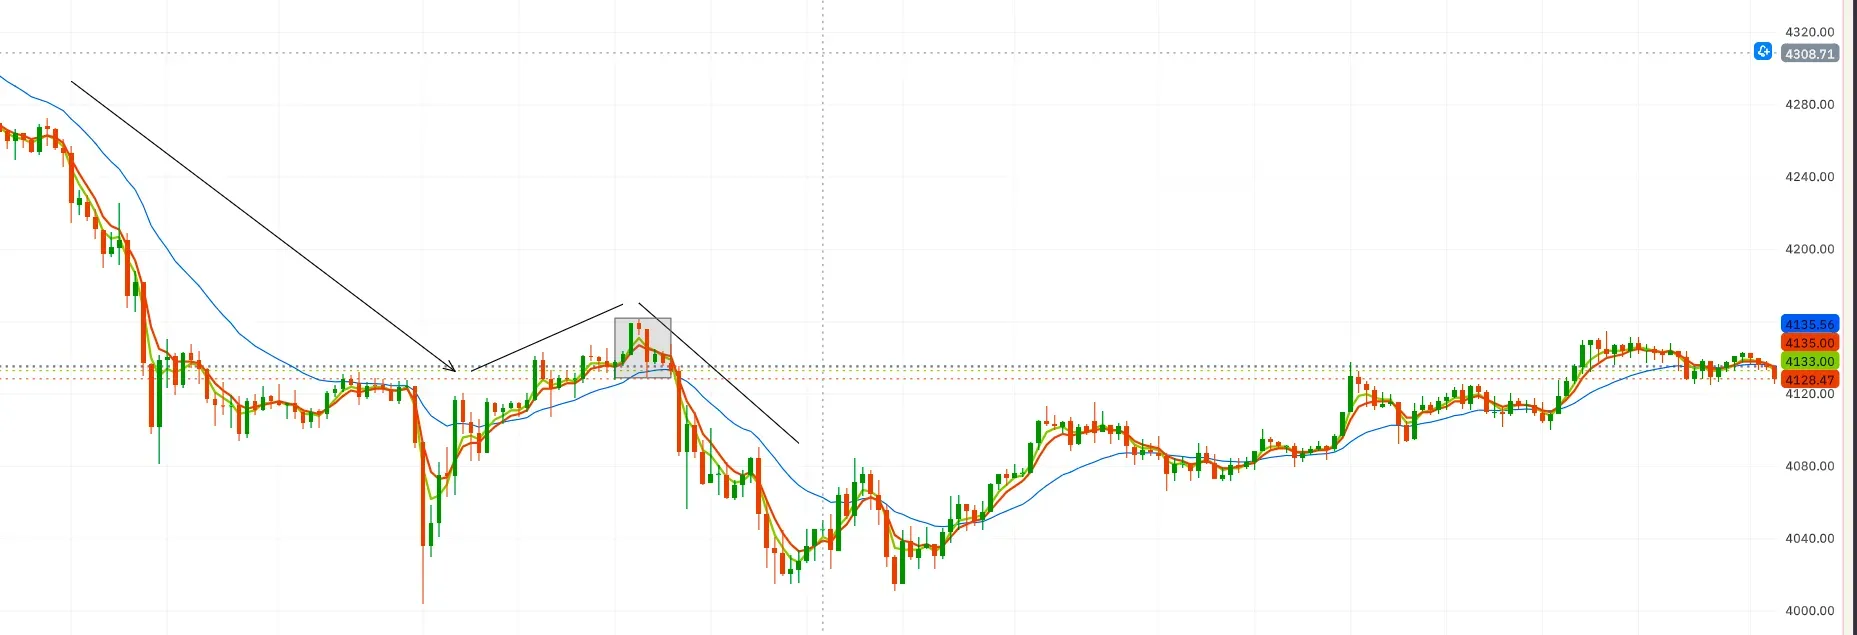
This is a simple indicator based on the EMA 3 and 5. Calculated on HLC while ignoring Open price for smoothing the price. Generally works on Stocks, Indices, Metals, BTC and ETH.
Why I use this
- To trade Key levels
- To confirm that 2 and 3 candle Engulfing
- To have tight SL
Time Frame
Stock = 15m to Monthly
Indices = 1min to Monthly
XAUUSD = 5min to 4hr
BTC & ETH = 5min to 1hr
How to trade
- Wait for price to come near Key levels
- Trade HTF direction
- Wait for a engulfing candle [2 or 3 Candles]
- Wait for the price to close above both the Lines
- Keep SL on the low of the formation
- Don't trade when there is huge Imbalance in price [very large candles]
- Don't Counter trade the trend
- Don't over trade in consolidation
- Trade only on Retracement/Pullbacks
- Trade during NY or London Session for Greater winrate

#XEBwasHere
Thanks to MR Sharma, for introducing me to this system.
© Licensed under MIT

Comments