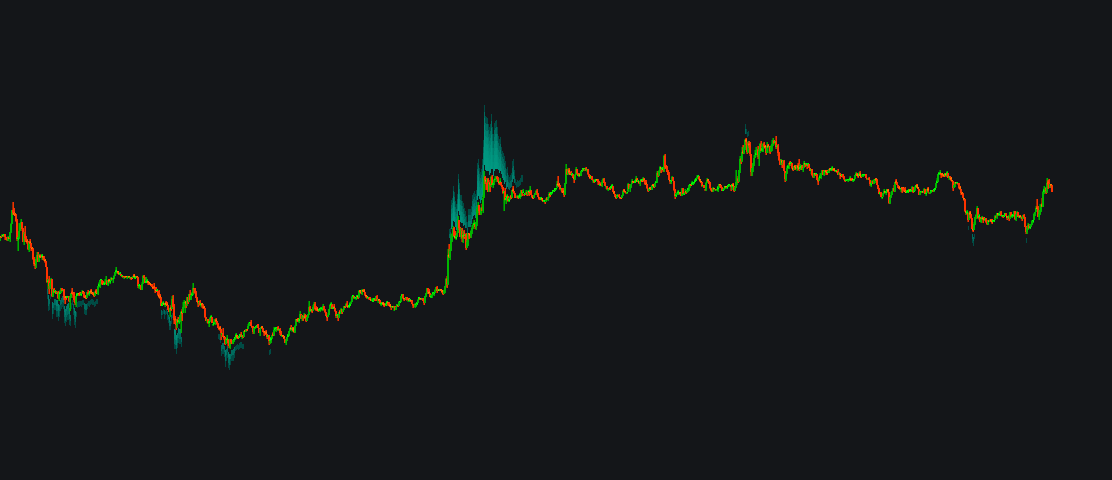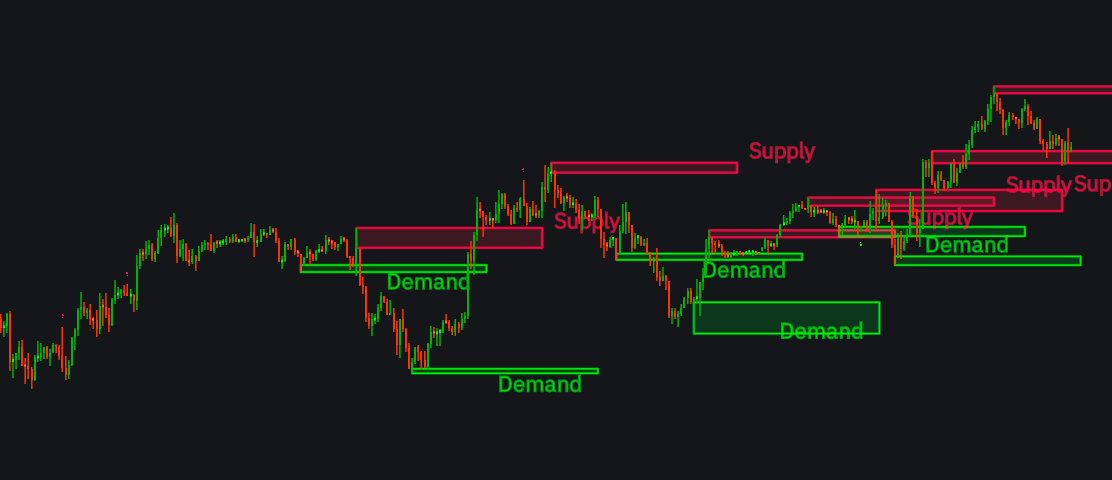

Demand and supply Indicator in Any Platform
Sniper
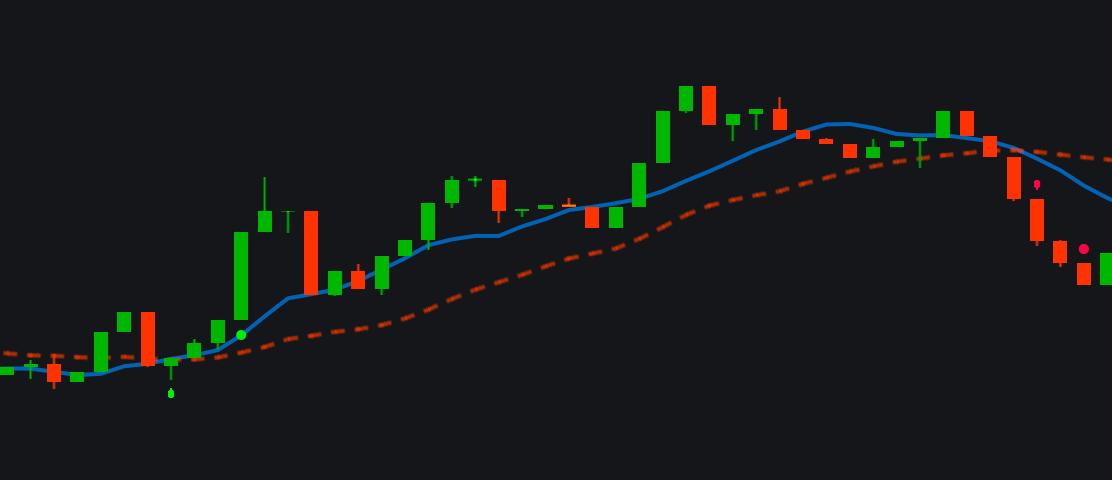
Signal This is a well-structured, genuinely useful indicator. The
concept is solid and the implementation is mostly clean. Here's an honest
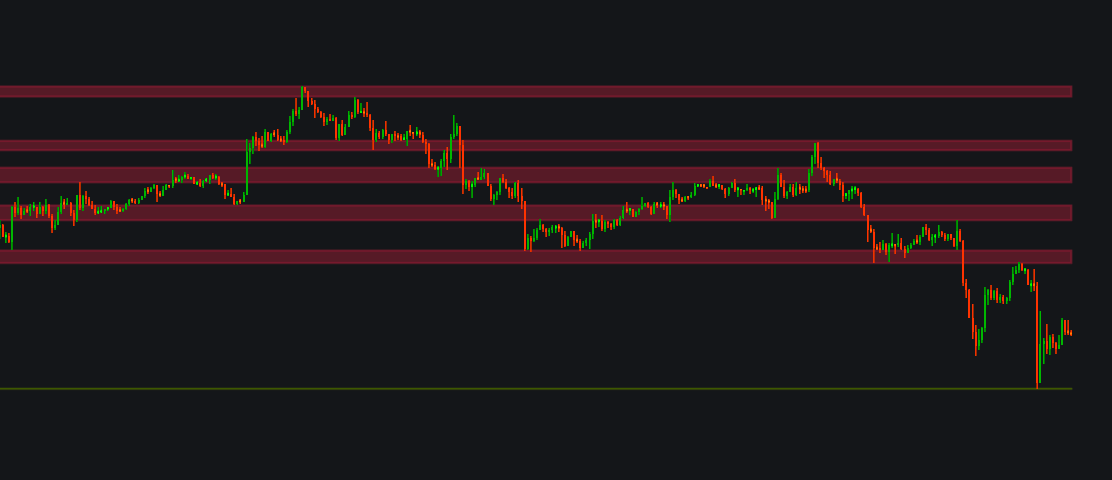
breakdown: Strengths Concept Supply & demand zones from swing pivots — a proven,
widely-used methodology Zo…
Sniper
Signal This is a well-structured, genuinely useful indicator. The
concept is solid and the implementation is mostly clean. Here's an honest
breakdown: Strengths Concept Supply & demand zones from swing pivots — a proven,
widely-used methodology Zo…