Lesson 1: Key Levels?
This is the lesson 1 of 30

Market only provides you information about four things -
- OPEN
- HIGH
- LOW
- CLOSE
These are called OHLC.
These OHLC acts as a important KEY LEVELS for trading.
Not every candles OHLC matters but the candle of the Higher Time Frame [HTF].
For example you are a Scalper who trades on 1 min time frame, for you 15 min time frame might be the HTF or we you are a Intraday trade (who holds the trade till the end of the session) daily time frame might be Right HTF or perhaps 4hr might be the best HTF. But for a investor weekly and monthly are the HTF.
Marking the OHLC of a HTF/ Trading Session
I recommend marking the previous HTF candle / Session OHLC because these are the magnets where price wants to move. High and Low the HTF candle where the most order are located, so when the market needs to fill large quantity of orders, the prices move to High and Low of the day.
How I trade using OHLC
For Longs
- The price should be inside the previous candle OHLC.
- The price should retrace with low volume/ weak candle.
- There must be 2 or 3 candle engulfing on LTF.
- The Candle close should be above the
Breakout Lines Indicator. - Target the ATR of the HTF Candle.
- Make sure everything lines up with other factors of your setup.
for Shorts
- Vice Versa of Longs.
- Price may be fast.
- Retracement may become a wick on LTF.
Breakout Line Indicator [BLI]
Is a free indicator [Will be published within a week or so]. Which is developed by me, Its almost same as 3 and 5 EMA line, but only works on assets with 000.00 or 0000.00 [works BTC, NAS100, XAU/USD & not with Forex pairs and assets under $100]
I use this indicator for
- Change in market direction/ Minor trend reversal for trade towards HTF OHLC.
- To check whether 2 or 3 candle engulfing close under BLI to enter trade
- If price is crossing BLI on HTF, expect for a consolidation for a while on LTF

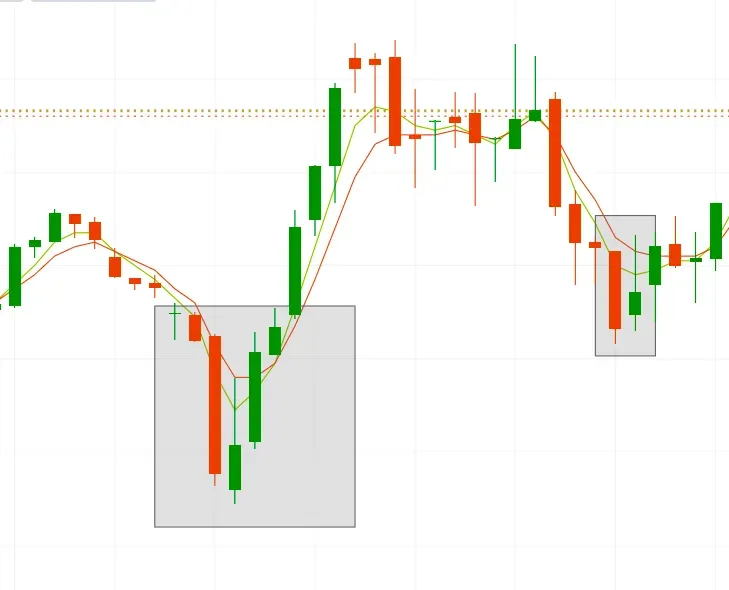
The chart is taken form 1 min time frame from 24-10-2025.
The HTF Trend is Bullish, Retracement --> Engulfing --> Price close above BLI --> Long on 3/2 Candle --> SL at Low of the candle
------
This is my first time writing Content, I haven't used any AI to write this, so sorry for my typo errors.
Thanks for reading till here
#XEBwasHere !!


