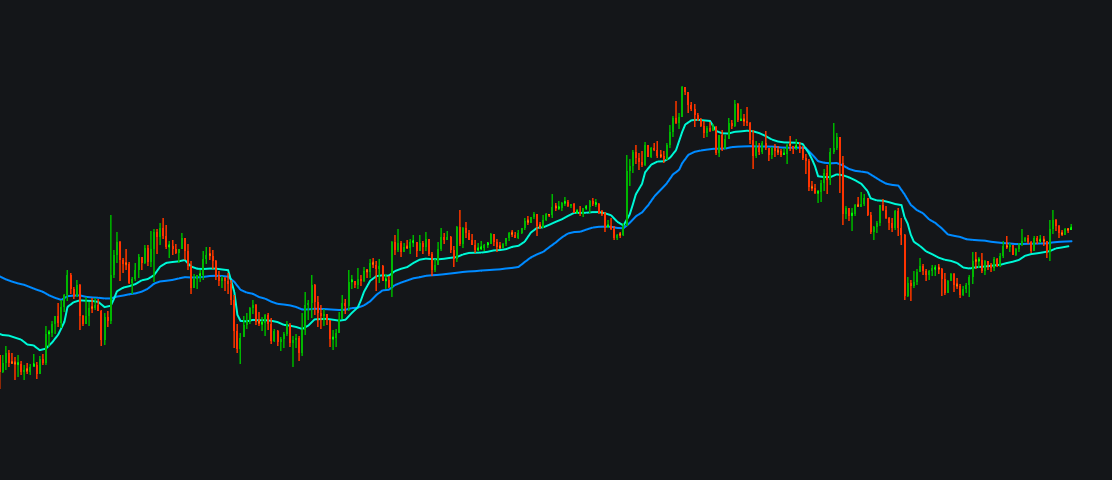
Grey's Smart Money Breakout Channels image
Grey's Smart Money Breakout Channels
Grey's Smart Money Breakout Channels  This indicator spots moments when big traders and institutions are getting ready to move the market. It automatically finds price areas where smart money is quietly buying or selling, then draws clear channels around…
/indicator/grey-s-smart-money-breakout-channels-23
Grey's Crossover Signals Indicatorimage
Grey's Crossover Signals Indicator
Grey's Crossover Signals Indicator Get clean, visual Buy/Sell alerts based on the classic 5/13 EMA crossover This indicator generates clear buy and sell signals based on the crossover of two customizable moving averages, such as EMA 5 and EMA 13, to help…
/indicator/grey-s-crossover-signals-indicator-52
Dynamic Support & Resistance Pro+image
Dynamic Support & Resistance Pro+
Dynamic SR Pro+ Dynamic SR Pro+ is an advanced support and resistance indicator that makes price level analysis easier and clearer. It combines RSI, Chande Momentum Oscillator, and pivot points to automatically highlight key zones where price may react. …
/indicator/dynamic-support-resistance-pro-96
Fixed Range Volume Profile FRVPimage
Fixed Range Volume Profile FRVP
Fixed Range Volume Profile (N Bars) Fixed Range Volume Profile  indicator is designed to visualize volume distribution within a fixed range across price levels with precision. This advanced tool overlays a detailed volume profile directly on your chart, …
/indicator/fixed-range-volume-profile-frvp-26
Trendlines with Breaksimage
Trendlines with Breaks
The Trendlines with Breaks indicator plots trendlines based on pivot points and marks breakout events when price crosses them. Users can adjust the the steepness of the trendlines as well as their slope calculation method. Breakouts are detected in real …
/indicator/trendlines-with-breaks-27
Whole Numbers image
Whole Numbers
Whole Numbers Indicator Automatically plots key psychological support and resistance levels where price often reacts. These whole number zones are where smart money and institutions make trading decisions. Updates dynamically as price moves, giving you h…
/indicator/whole-numbers-74