
Trend Impulse Channels
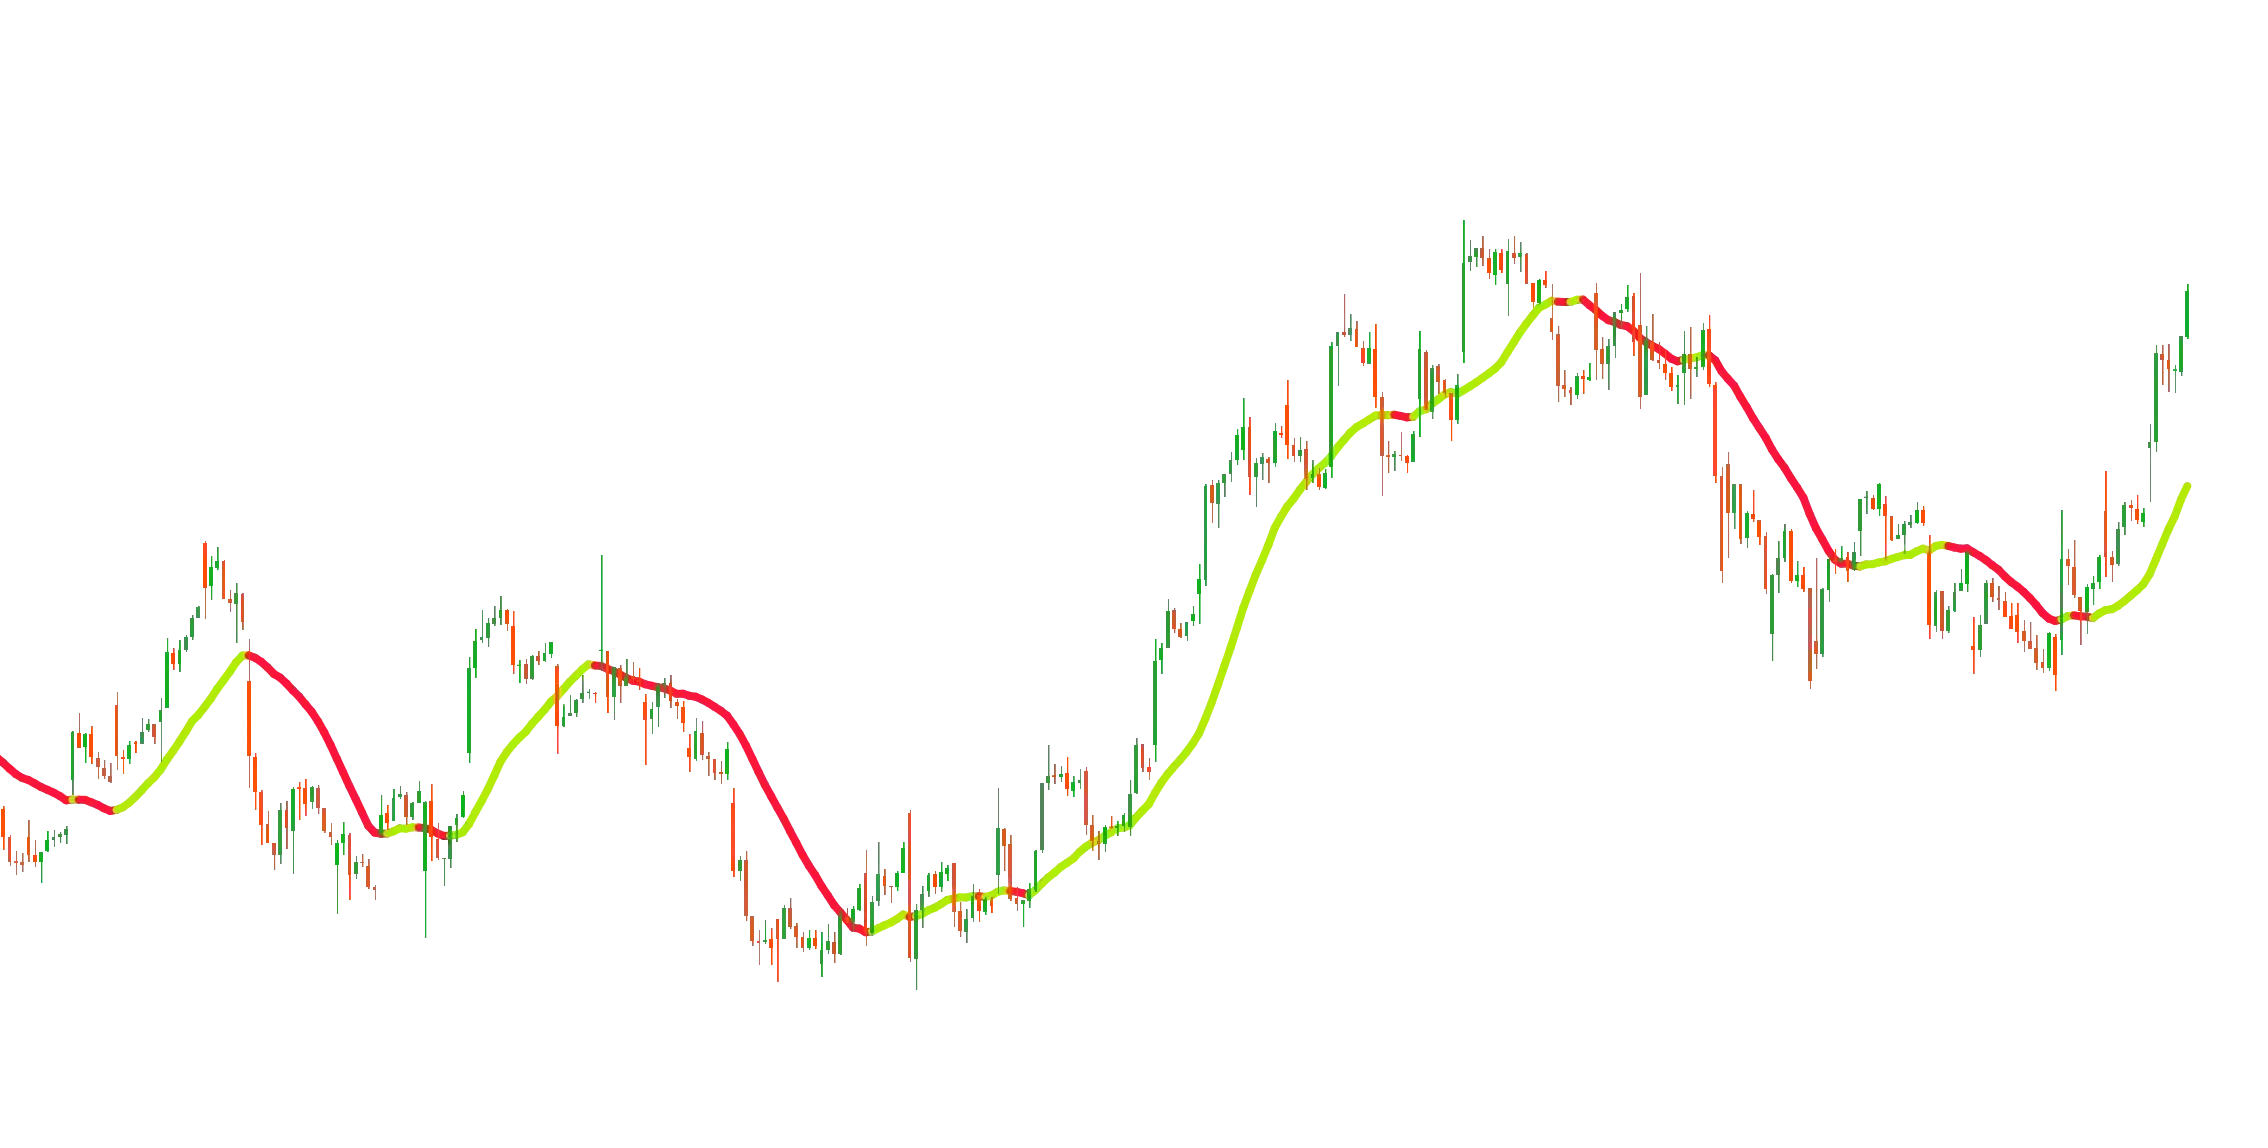
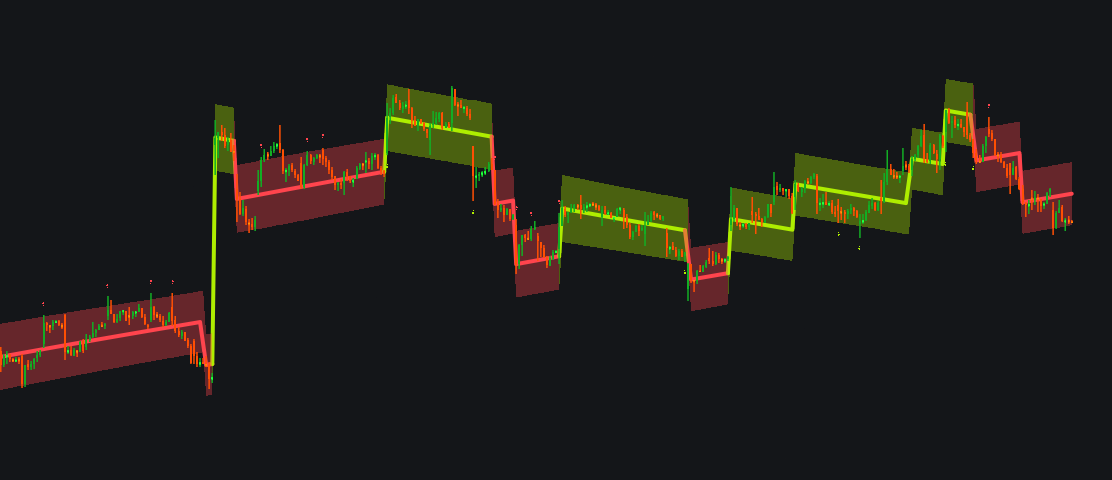
O verview Trend Impulse Channels is a trend-following framework designed to represent market progression in clear, stepwise movements. Instead of tracking trends with continuous slopes, it defines discrete “trend steps” that are confirmed only when price…
O verview Trend Impulse Channels is a trend-following framework designed to represent market progression in clear, stepwise movements. Instead of tracking trends with continuous slopes, it defines discrete “trend steps” that are confirmed only when price…