Bitcoin überblickimage
Bitcoin überblick
Besonders Interessant für ein mögliches Etappen Ziel ist die Custerzone, welche sich aus den Rebounds 127 dieser beiden Muster ergibt. 
Bitcoin überblick
Understand the best Multi-Timeframe Pattern System (2/2)image
Understand the best Multi-Timeframe Pattern System (2/2)
In the first video, we talked about what Multi-Timeframe Logic is and how we use Clusterzones to generate protectable, high CRV entries. This video is more about how the different timeframes are interconnected with each other and how you can use that to your advantage in your trading. 
Understand the best Multi-Timeframe Pattern System (2/2)
Meta: My first Analysisimage
Meta: My first Analysis
Hey everyone! I've tried some strategies and now want to start analyzing charts and share my first analysis with you :)
Meta: My first Analysis
Formationimage
Formation
 Es besteht aus 3 Tops mit einem höheren Hoch in der Mitte, dem sogenannten Kopf. Die Linie, welche die zwei Täler verbindet, ist die Nackenlinie. Die Höhe des letzten Tops kann höher sein als das erste, aber nicht höher als der Kopf. Mit anderen Worten, der Preis hat versucht, ein höheres Hoch zu machen, ist aber gescheitert. Je näher die beiden äußeren Tops am gleichen Preis liegen, desto genauer ist das Muster.Wenn eine Kerze die Nackenlinie durchbricht und unterhalb dieser schließt, ist das Muster abgeschlossen.  Das Ziel kann geschätzt werden, indem man die Höhe des Musters (von Nackenlinie bis zum Kopf) misst und dieses nach unten projiziert. Übliche Stop-Level befinden sich oberhalb der Nackenlinie oder oberhalb der rechten Schulter. Eine weitere Methode ist das der Stop an der 50% Strecke des Kopfes gesetzt wird. Dies verbessert das Chancen Risikoverhältnis. 
Formation
CME Update: 06.11.2024image
CME Update: 06.11.2024
CME hit its target of $230 with +14.55% from the time of publishing the initial idea and 10.86% from the break of the trendline.
CME Update: 06.11.2024
BTC Trigger Situationimage
BTC Trigger Situation
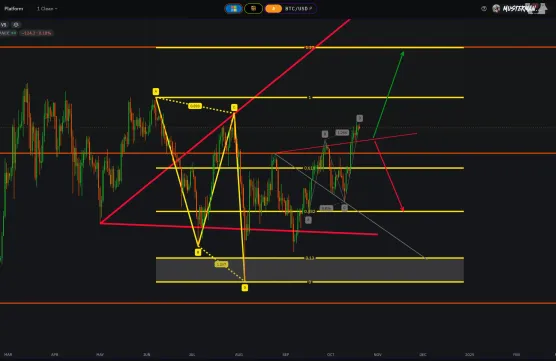
Die Situation wird sich vermutlich an der Signallinie des untergeordneten Wolfes entscheiden.Prallen wir untergeordnet ab, so ist mit einem zügigen anstieg bis zum Rebound 127 (gelb) zu rechnen. Kommen wir durch die Signalinie durch, so ist mit einem Rücksetzer nach der grauen ABCD Projektion auszugehen. More read here
BTC Trigger Situation
Nike (NKE) Fiscal Q4 2025 Earnings & Investor Sentiment: Is the Swoosh Still a Buy?image
Nike (NKE) Fiscal Q4 2025 Earnings & Investor Sentiment: Is the Swoosh Still a Buy?
Nike’s latest earnings report has reignited the debate among investors: is this iconic brand merely stumbling, or has it lost its edge in an increasingly competitive market? With Q4 2025 financials now public and retail investor sentiment sharply divided, it's time to reassess Nike’s near- and long-term prospects.
Nike (NKE) Fiscal Q4 2025 Earnings & Investor Sentiment: Is the Swoosh Still a Buy?
Special Topic China Stocks
After the Chinese indices were in a downtrend for a long time, the Chinese dragon has awakened with a "bang." The interest rate cut and various investment programs by the Chinese central bank and government organizations for real estate and stocks are reminiscent of Alan Greenspan, who started to officially intervene in the financial markets after Lehman.In my view, the Chinese are not dogmatic and are quite willing to import successful models. The use of one's currency and printing money to strengthen the country is more than common in the West, so why not in China? I consider this trend reversal to be sustainable, even if I expect a certain pullback after this impulsive breakout. I'm not alone in this view, as this article about a US hedge fund manager also indicates: https://lnkd.in/dwsf9ravDespite the euphoria, it’s important to note that political risks from tensions between China and the USA still exist. Therefore, my position in Chinese stocks will never exceed the 10% mark of my portfolio unless it’s driven by price gains. The chart shows that investors have followed this breakout, investing in major Chinese ETFs (such as the Krane Internet Stocks ETF). Among them are likely some hedge funds that were caught off guard and now have to cover their short positions.My focus is on large Chinese companies and European firms with significant stakes in Chinese companies. My scenario is that the second gap will close, offering another buying opportunity. The first gap, in my view, will remain open as a "runaway gap."
Special Topic China Stocks
New Sectors aheadimage
New Sectors ahead
Important figures for my portfolio are due this week, some second-tier tech stocks (chip & AI stocks), which have outperformed the market in recent weeks, will show whether this part of my portfolio remains invested. The relative strength of technology stocks (especially Big Tech) means that they are no longer investments. What is exciting is the utilities sector, which has not shown any signs of life for a long time, but is apparently being rediscovered by the major analyst firms, with Goldman Sachs publishing two detailed studies with the following headlines:- "Electrify Now: Powering Up Europe: AI, Datacenters, and Electrification to Drivec. 40% Growth in Electricity Consumption"- "Generational Growth: AI, Data Centers and the Coming US Power Demand Surge"At its core, this is about the energy requirements of the AI trend, so it's no surprise that some utility stocks have made it onto my watchlist. In addition to the increased growth prospects, they currently offer low valuations and, in some cases, attractive dividends. It's not just chart technicians who are taking advantage of this. This example is another wonderful example of the "power" of technical analysis, which picks up on the first signs of new sector trends a few weeks before the analysts' studies are published.If you want to know more about the analyses, just write a comment, if you are interested I will add a new article.#charting #KI #coaching #supervision #wealthmanagement
New Sectors ahead