Vidyaimage
Vidya
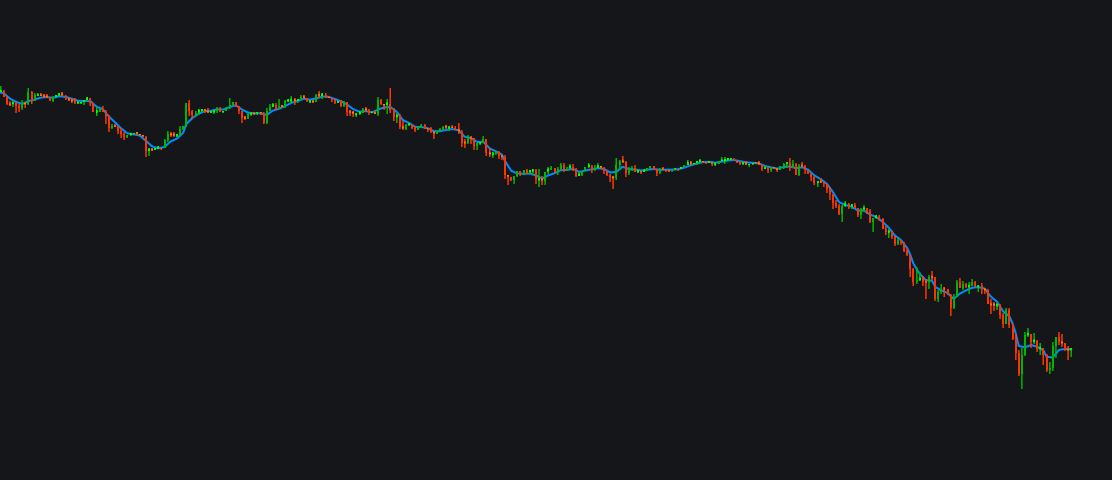
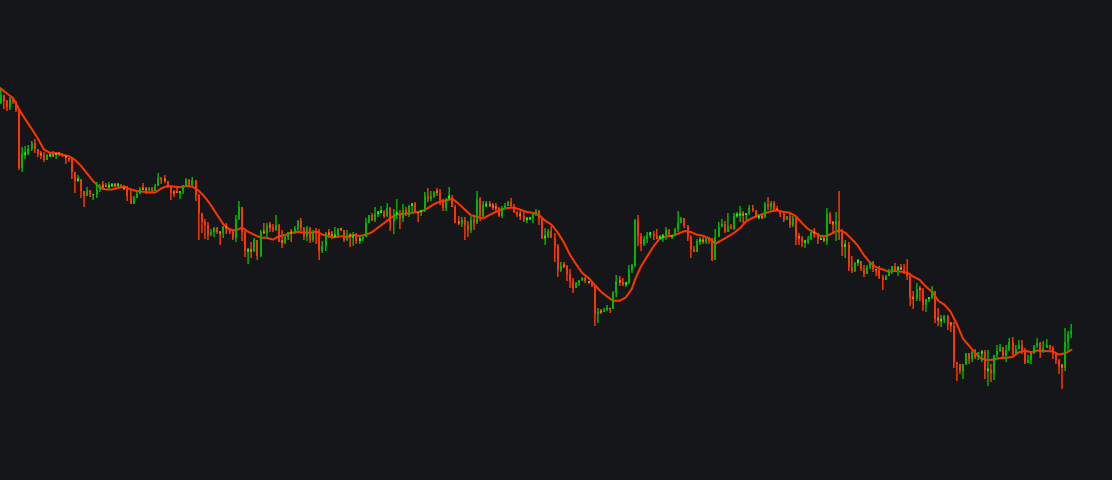
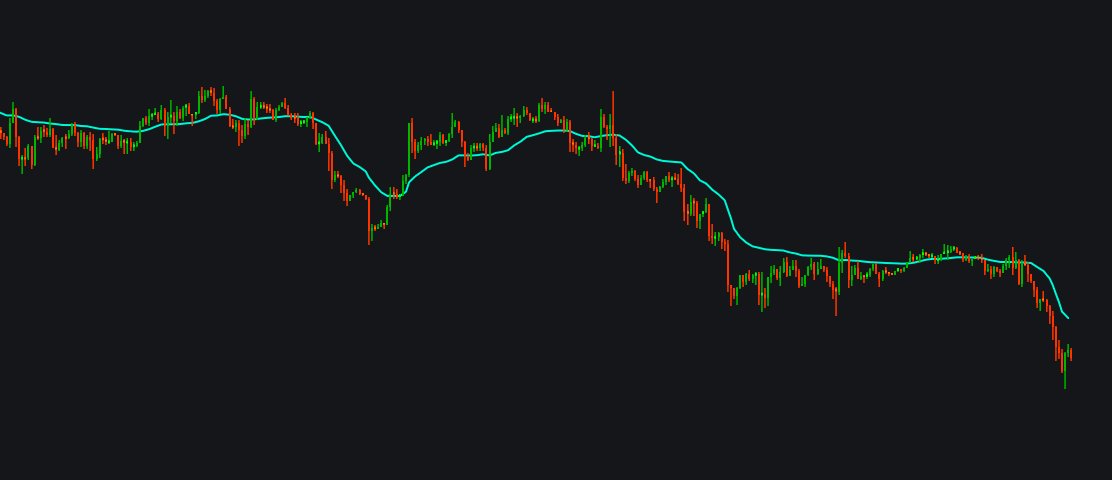
The VIDYA  (Variable Index Dynamic Average) is an adaptive technical analysis tool created by Tushar Chande. Unlike traditional moving averages that use static smoothing, VIDYA dynamically adjusts its sensitivity based on market volatility using the Ch…
/indicator/vidya-74
Generalized DEMAimage
Generalized DEMA
The Generalized DEMA (Double Exponential Moving Average), or GDEMA, is a technical analysis indicator developed by Tim Tillson. It enhances the standard DEMA—which was created by Patrick Mulloy to reduce traditional moving average lag—by introducing an a…
/indicator/generalized-dema-69
Directional Movement using Hann (DMH)image
Directional Movement using Hann (DMH)
The Directional Movement using Hann (DMH) is a modernized, smoothed version of J. Welles Wilder's classic Directional Movement Index (DMI). Introduced by renowned quantitative analyst John Ehlers in 2021, the DMH uses a Hann windowing function to reduc…
/indicator/directional-movement-using-hann-dmh-29
Geometric Mean Moving  Averageimage
Geometric Mean Moving Average
The Geometric Mean Moving Average (GMMA) is a statistical tool used in financial trading to smooth out price data and identify trends. Unlike standard moving averages that add  data points, the GMMA multiplies  them. This unique formula gives the line …
/indicator/geometric-mean-moving-average-76
Squeeze Momentumimage
Squeeze Momentum
The Squeeze Momentum Indicator  ( popularized by LazyBear on TradingView and derived from John Carter's "TTM Squeeze" ) is a volatility and trend tool. It helps traders spot quiet, consolidating markets (the "squeeze") that typically precede explosive p…
/indicator/squeeze-momentum-12
CCI - commodity channel index + Alertsimage
CCI - commodity channel index + Alerts
CCI with Alerts: Indicator Overview The CCI (Commodity Channel Index) with Alerts is a versatile, momentum-based technical indicator designed to identify cyclical trends, determine overbought or oversold market conditions, and spot potential trend reve…
/indicator/cci-commodity-channel-index-alerts-63