
kaufman Adaptive Moving Average dual KAMA
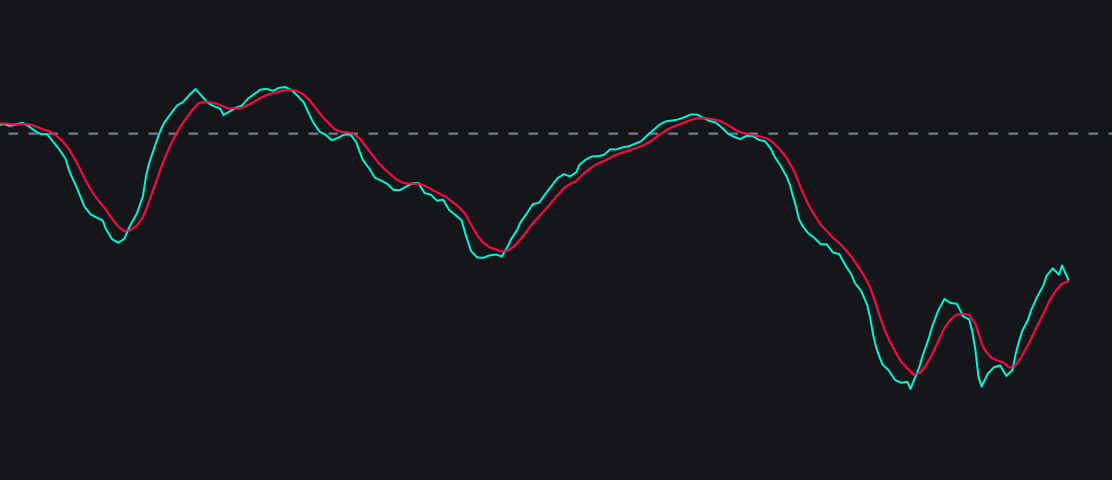
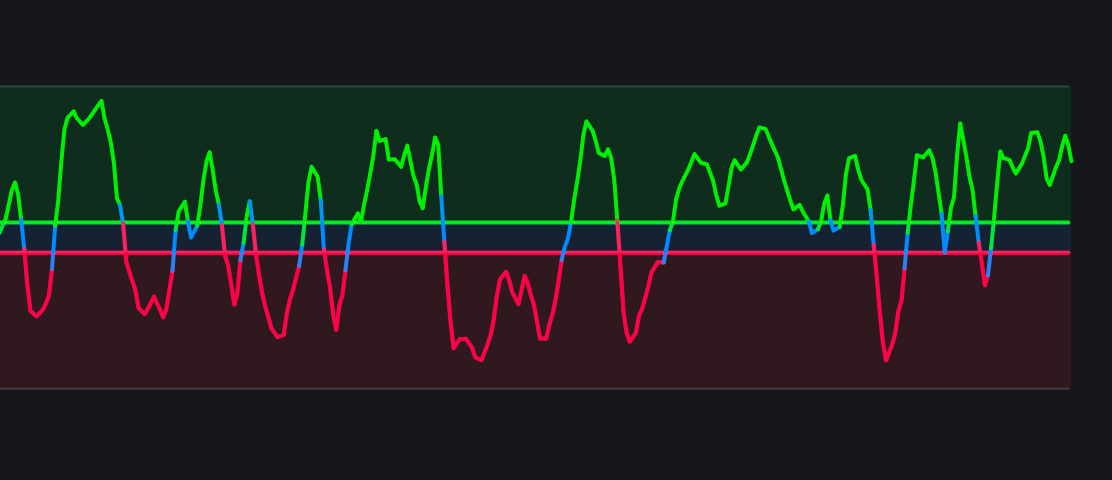
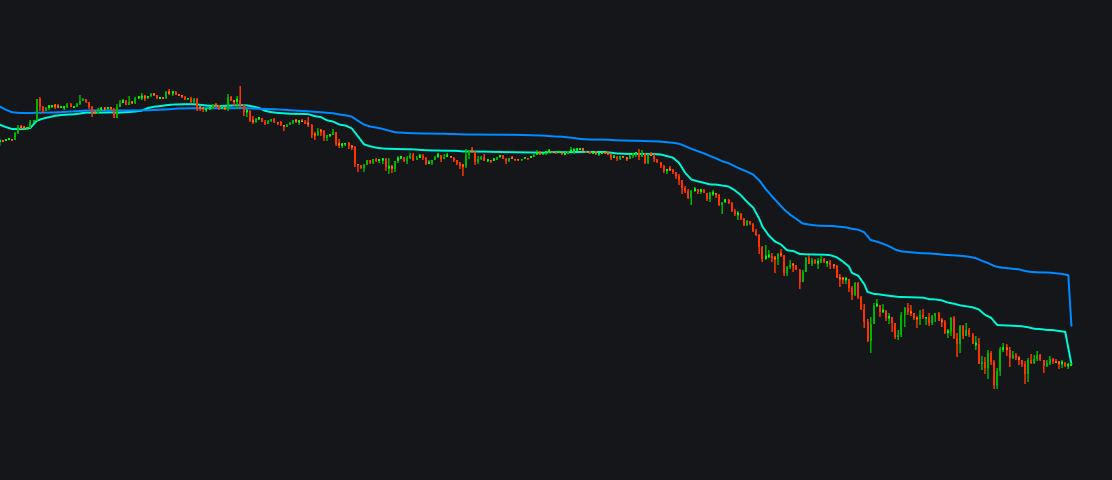
# Kaufman Adaptive Moving Average (Dual KAMA) – Free Indicator A dual adaptive moving average system that tracks both short‑term and long‑term trends. The indicator plots two KAMA lines (Fast and Slow) and colors candles based on their relative position.
# Kaufman Adaptive Moving Average (Dual KAMA) – Free Indicator A dual adaptive moving average system that tracks both short‑term and long‑term trends. The indicator plots two KAMA lines (Fast and Slow) and colors candles based on their relative position.