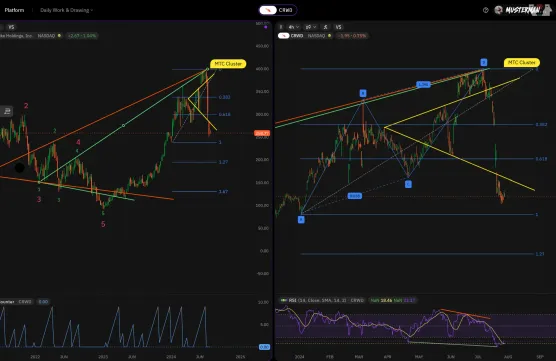
CrowdStrike - Multitimeframe Bomb Explodedimage
CrowdStrike - Multitimeframe Bomb Exploded
An update glitch triggered a significant price movement at CrowdStrike. As the good Lord would have it, this event occurred at a multi-cluster zone of technical analysis, which we will now look at in detail. In the following chart, we can see several technical analysis elements. In the left chart, we see two significant technical patterns, which we call wolf, consisting of 5 pattern points. We can put these wolf patterns in relation to each other. The red pattern, which is larger, is called the “superordinate pattern”, the green pattern is the “subordinate pattern”. In the 4h chart on the right, we see an ABCD harmonic pattern in blue. This is a pattern based on Fibonacci ratios. The indicator in the right window is an RSI, which, in this case, even shows a divergence. 
CrowdStrike - Multitimeframe Bomb Exploded
Bitcoin ABCD - RA1image
Bitcoin ABCD - RA1
Für unsere Nerds:B Blau ist Intra Rebound 167 Gelb. C Blau ist 13er Rücklauf. D Blau ist 127. Blau RA1 erfüllt.Kurz und knapp für alle anderen Wolf und Regelanlauf 1 erfüllt. 😊
Bitcoin ABCD - RA1
The new ATH for Bitcoinimage
The new ATH for Bitcoin
The #crypto markets are in the middle of a #bullrun with Bitcoin reaching a new all-time high.  The approval of the Bitcoin Spot ETF at the beginning of 2024 contributed massively to the legitimacy of the asset class.  With the next Bitcoin halving just ahead, we can only assume based on history that this price will continue to rise.  #HODL 
The new ATH for Bitcoin
Adobeimage
Adobe
In this area there is the option of a new wolf's mouth to approach the 13th retracement of the black swan. The middle line of the trend channel would be a relevant resistance.
Adobe
Quick Questionimage
Quick Question
I just want to preface by saying that this charting platform is insanely good. The UI feel is incredible and I am considering of switching from tradingview to this platform for charting. I am adding some moving averages to my chart and I can't help but notice that I can see the moving average labels on the price scale and it's a bit annoying. Is there a way to turn it off? Also, is there a way to hide my list of indicators? I have a pretty long list now. Thanks in advance! 
Quick Question
Amazon US-Wahl Party?image
Amazon US-Wahl Party?
Im Amazon Daily Chart zeigt sich derzeit eine besondere Kerzensituation  welche durch die Volatilität einer PopGun Kerzenkombination entstand.
Amazon US-Wahl Party?
Nike (NKE) Fiscal Q4 2025 Earnings & Investor Sentiment: Is the Swoosh Still a Buy?image
Nike (NKE) Fiscal Q4 2025 Earnings & Investor Sentiment: Is the Swoosh Still a Buy?
Nike’s latest earnings report has reignited the debate among investors: is this iconic brand merely stumbling, or has it lost its edge in an increasingly competitive market? With Q4 2025 financials now public and retail investor sentiment sharply divided, it's time to reassess Nike’s near- and long-term prospects.
Nike (NKE) Fiscal Q4 2025 Earnings & Investor Sentiment: Is the Swoosh Still a Buy?