Apr 18, 2024

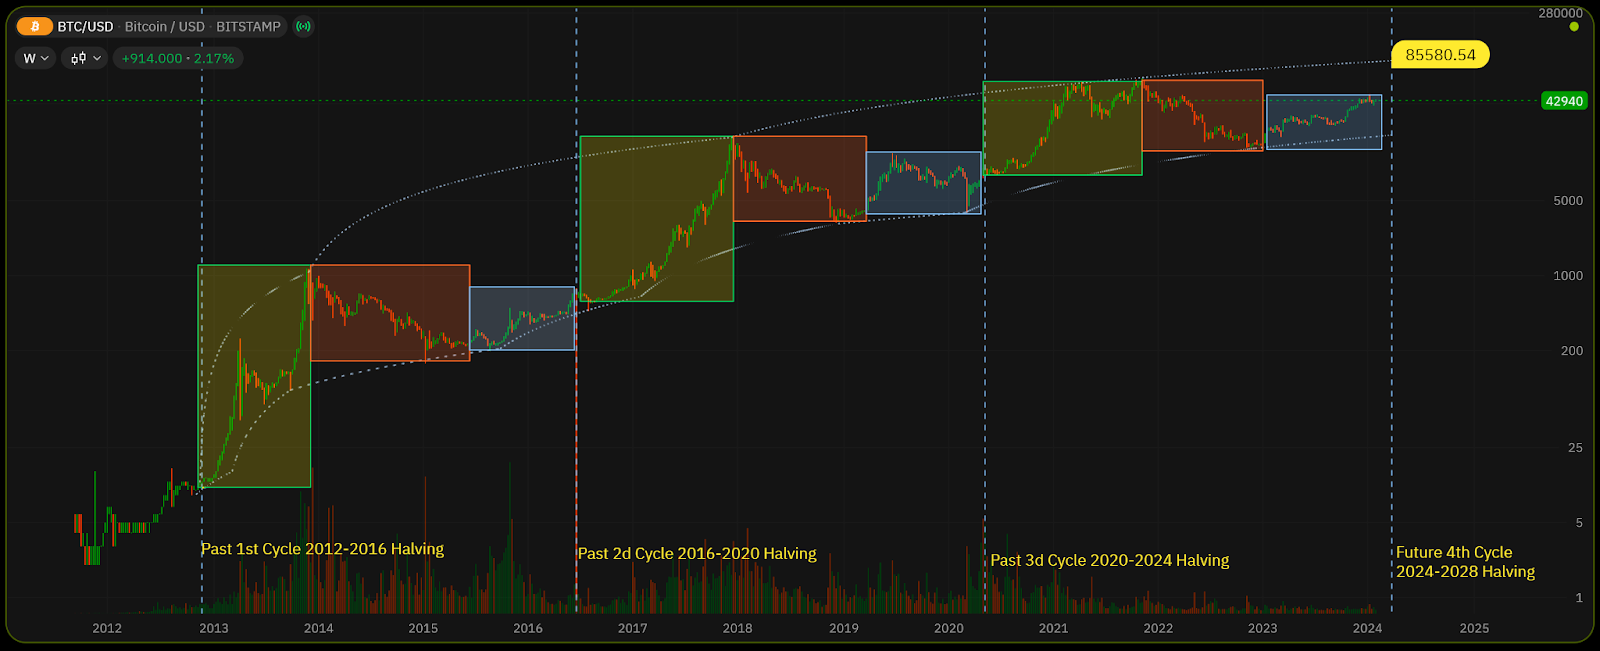
Navigating Bitcoin's Path: Insights from the Halving Cycle
Understanding the intricate movements of Bitcoin prices can be challenging for many. However, this article aims to provide a comprehensive view of the decade-old Bitcoin Halving cycle, a recurring pattern that has not only accurately predicted major price shifts but has also earned acknowledgment in academic circles. The insights shared here are designed to instill confidence in the presented thesis.


