
MACD + SMA 200 Enhanced (ChartArt Inspired)
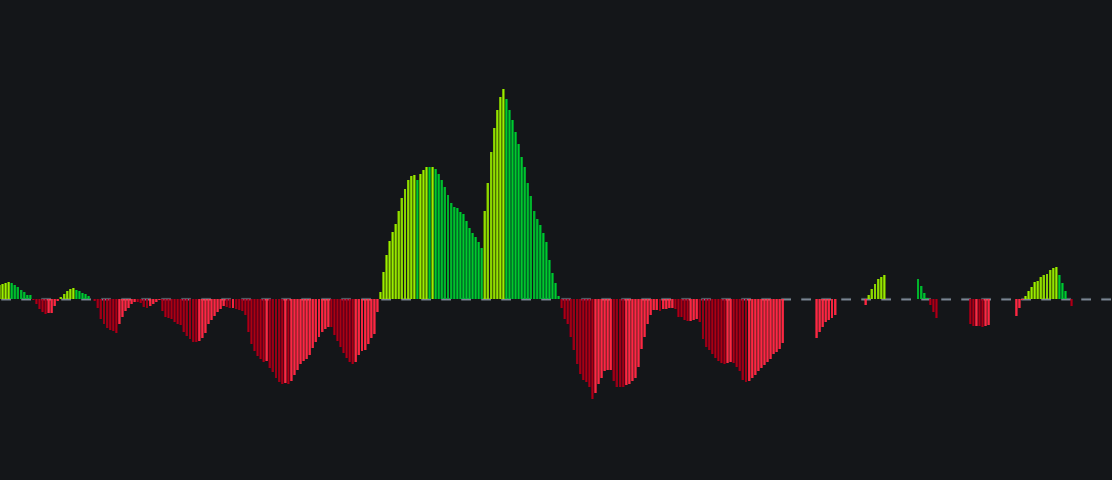
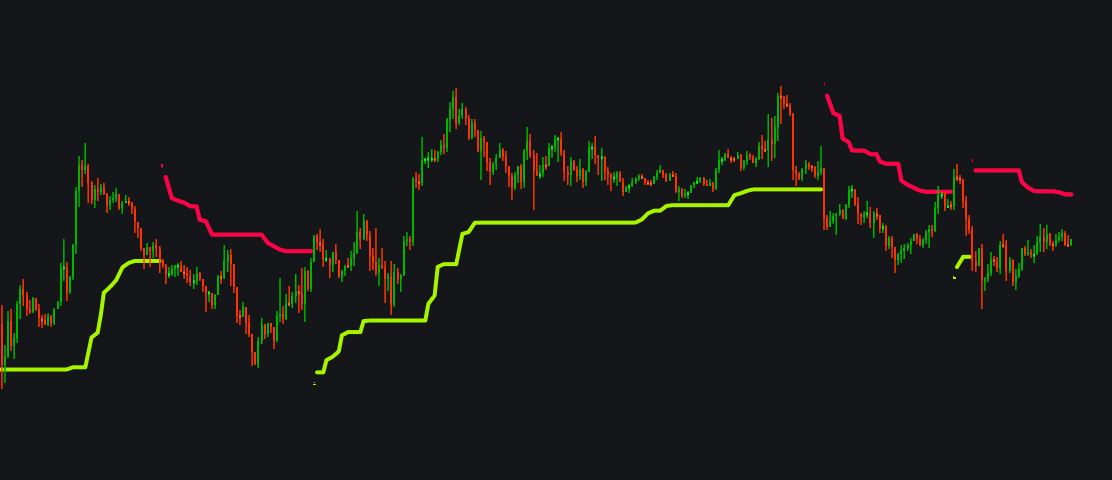
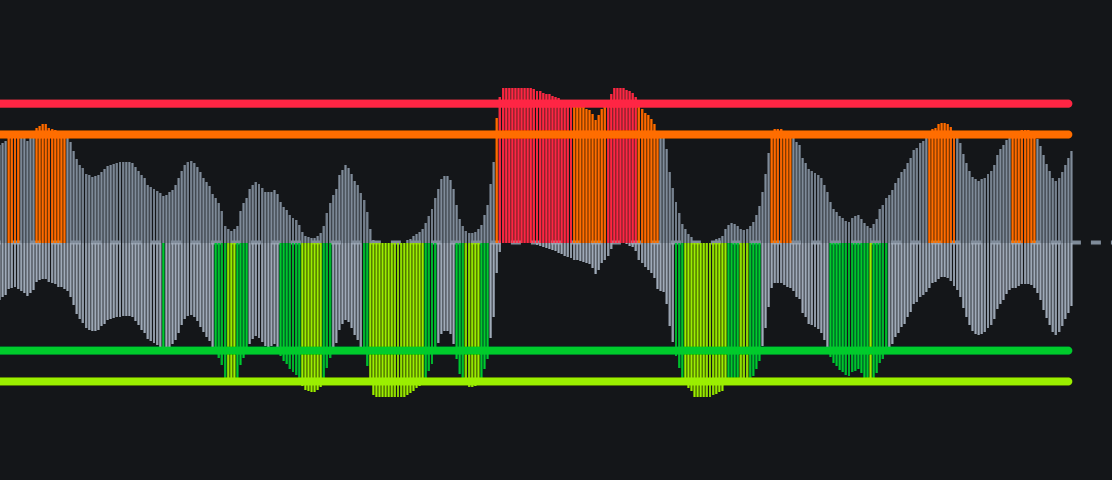
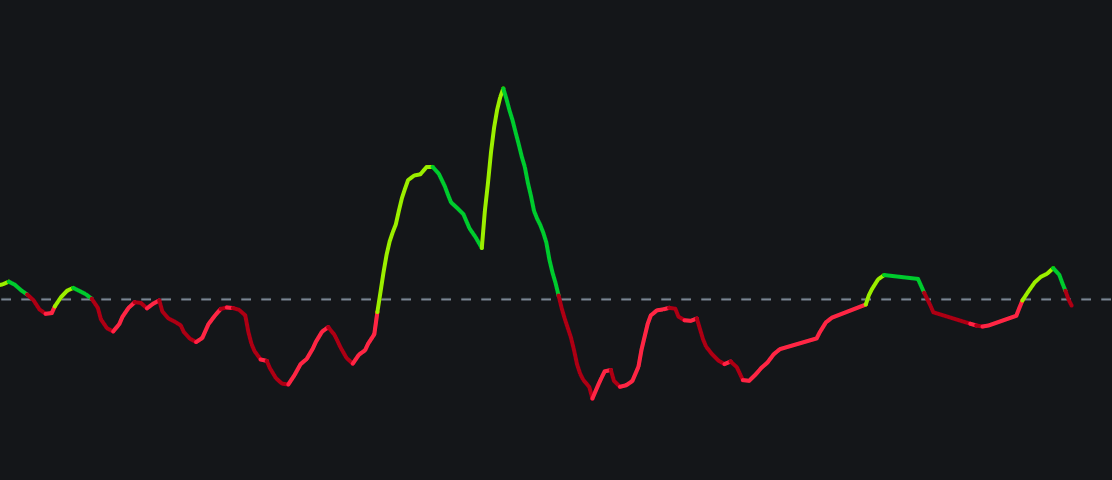
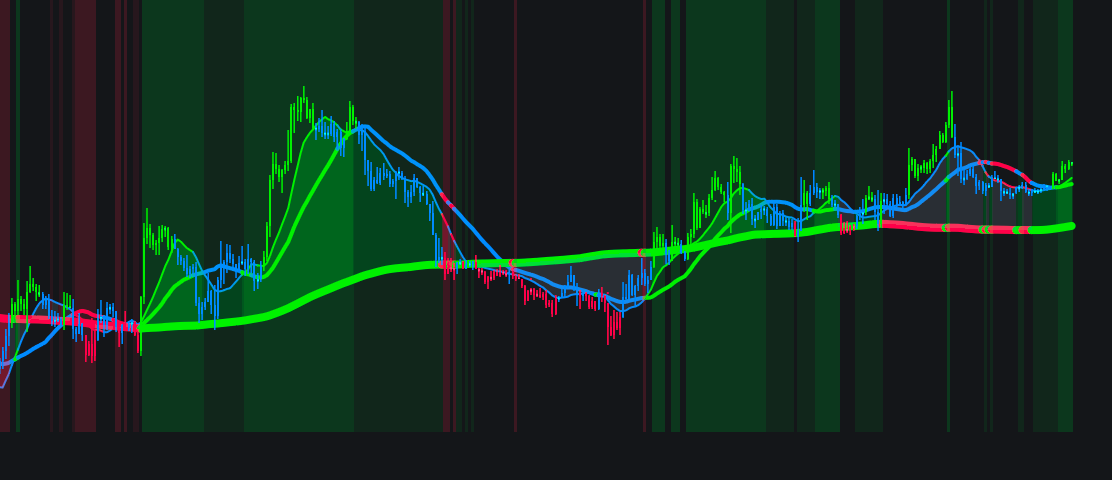
MACD + SMA 200 Enhanced — Trend Regime & Signal Indicator MACD + SMA 200 Enhanced is an improved Indie implementation of the classic MACD trend-confirmation concept originally popularized by ChartArt . The indicator combines MACD momentum analysis wit…
MACD + SMA 200 Enhanced — Trend Regime & Signal Indicator MACD + SMA 200 Enhanced is an improved Indie implementation of the classic MACD trend-confirmation concept originally popularized by ChartArt . The indicator combines MACD momentum analysis wit…